https://matplotlib.org/tutorials/introductory/pyplot.html#sphx-glr-tutorials-introductory-pyplot-py
Pyplot tutorial — Matplotlib 3.2.1 documentation
The text() command can be used to add text in an arbitrary location, and the xlabel(), ylabel() and title() are used to add text in the indicated locations (see Text in Matplotlib Plots for a more detailed example) All of the text() commands return an matp
matplotlib.org
import pandas as pd
titanic_df= pd.read_csv('train.csv')
titanic_df.drop(['PassengerId','Name','Ticket'], axis=1, inplace=True)
#칼럼 값보는 2가지 방법
print(titanic_df.columns.values)
print(titanic_df.columns)['Survived' 'Pclass' 'Sex' 'Age' 'SibSp' 'Parch' 'Fare' 'Cabin' 'Embarked']
Index(['Survived', 'Pclass', 'Sex', 'Age', 'SibSp', 'Parch', 'Fare', 'Cabin', 'Embarked'], dtype='object')
titanic_df.Age
titanic_df.Age.isnull().sum()
titanic_df.Age.mean() #평균나이 mean() 평균을 구하는 함수
titanic_df.Age.fillna(titanic_df.Age.mean(),inplace=True)
# titanic_df의 Age 항목의 Nan값을 채우는데(fillna) 평균값(titanic_df.Age.mean())으로 채운다.
titanic_df.Age.isnull().sum() # null값이 총 몇 개인지 보여준다.
0
titanic_df.Cabin
titanic_df.Cabin.isnull().sum()
print(titanic_df.Cabin.isnull().sum())# null값이 총 몇 개인지 보여준다. 지금은 687개
print()
titanic_df.Cabin.fillna('N',inplace=True) #null값에 N을 넣어준다.

titanic_df.Cabin.isnull().sum()
print(titanic_df.Cabin.isnull().sum())#이제 null값이 없다. 0개
print()

titanic_df.Cabin.value_counts() #값 게수를 보여준다.
print(titanic_df.Cabin.value_counts())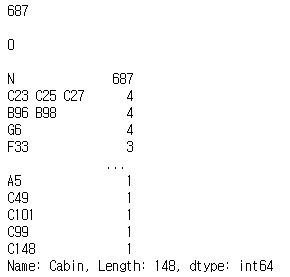
titanic_df.Embarked
titanic_df.Embarked.isnull().sum()
titanic_df.Embarked.fillna('N',inplace=True)
titanic_df.Embarked.isnull().sum()
print(titanic_df.Embarked.value_counts())
from sklearn.preprocessing import LabelEncoder
titanic_df.Cabin = titanic_df.Cabin.str[:1]

le = LabelEncoder()
titanic_df.Cabin = le.fit_transform(titanic_df.Cabin)
#fit_transform : 맞춰서 변환한다.
#영어가 숫자로 변환해서 바뀐다.
print(titanic_df.Cabin)
print()

titanic_df.Sex = le.fit_transform(titanic_df.Sex)
#le객체를 이용하여 fit_transform(맞춰서) 변환한다.
print(titanic_df.Sex)
print()

titanic_df.Embarked = le.fit_transform(titanic_df.Embarked)
print(titanic_df.Embarked)

titanic_df.head()

Q. Titanic 가공한 내역을 정리하고 이를 쉽게 재사용할 후 있도록 종합 전처리 함수를 만드세요.(def transform_features(df):)
# titanic_df = sns.load_dataset('titanic')
# 앞에서 설정한 Data Preprocessing 함수 호출

from sklearn.preprocessing import LabelEncoder
import numpy as np
import pandas as pd
import seaborn as sns
import warnings
warnings.filterwarnings('ignore')

# Null 처리 함수
def fillna(df):
    df['Age'].fillna(df['Age'].mean(), inplace=True)
    df['Cabin'].fillna('N', inplace=True)
    df['Embarked'].fillna('N', inplace=True)
    return df

# 머신러닝 알고리즘에 불필요한 속성 제거(PassengerId, Name, Ticket)
def drop_features(df):
    df.drop(['PassengerId','Name','Ticket'], axis=1, inplace=True)
    return df

# 레이블 인코딩
def format_features(df):
    df['Cabin'] = df['Cabin'].str[:1]
    features = ['Cabin','Sex','Embarked']
    for feature in features:
        le = LabelEncoder()
#         le = le.fit(df[feature])
        df[feature] = le.fit_transform(df[feature])
    return df

#format_features(df) 메소드 처리 과정
# titanic_df.Cabin = titanic_df.Cabin.str[:1] # 첫 번째 글자만 추출(0번째 글자만 추출)

# le = LabelEncoder() # 레이블인코더를 써서 인코딩, 객체 생성
# titanic_df.Cabin = le.fit_transform(titanic_df.Cabin) # fit_transform 으로 값을 숫자로 변경시킨다.
# print(titanic_df.Cabin)

# titanic_df.Sex = le.fit_transform(titanic_df.Sex)
# print(titanic_df.Sex)

# titanic_df.Embarked = le.fit_transform(titanic_df.Embarked)
# print(titanic_df.Embarked)


# 앞에서 설정한 Data Preprocessing 함수 호출
def transform_features(df):
    df = fillna(df)
    df = drop_features(df)
    df = format_features(df)
    return df

titanic_df = pd.read_csv('train_df.csv')
transform_features(titanic_df.head())

# 호지수씨 참조
#https://blog.naver.com/hojysoo

시계열 데이터
- df의 행인덱스로 사용하면 시간으로 기록된 데이터를 분석하는 것이 매우 유용
- 특정시점을 기록하는 Timesstamp와 두시점 사이의 일정한 기간을 나타내는 Period 가 있음
- 문자열 또는 숫자로 저장되어 있는 시간데이터를 시계열 객체인 Timesstamp로 변환하는 함수를 제공
- 판다스 to_datetime()함수를 사용하면 문자열등 다른 자료형 판다스 Timesstamp를 나타내는 datetime64자료형으로 변환 가능.
#라이브러리 불러오기
import pandas as pd

#read_csv()함수로 CSV파일을 가져와서 df로 변환
df = pd.read_csv('stock-data.csv')

#데이터 내용 및 자료형 자료형 확인
display(df.head())
print('\n')
display(df.info())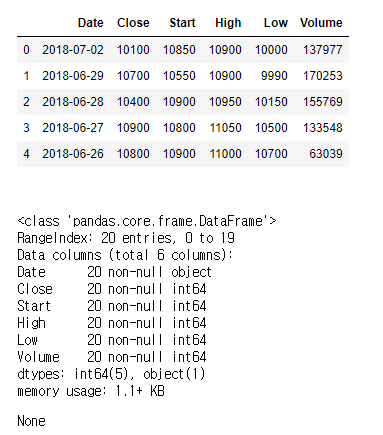
#문자열 데이터(시리즈 객체)를 판다스 Timestamp
df['new_Date']=pd.to_datetime(df['Date']) ##df에 새로운 열로 추가

#데이터 내용 및 자료형 확인
print(df.head())
print()
print(df.info())
print()
print(type(df['new_Date'][0]))

#시계열 값으로 변환 된 열을 새로운 행 인덱스로 지정, 기존 날짜 열은 섹제
df.set_index('new_Date', inplace=True)
df.drop('Date',axis=1, inplace=True)

#데이터 내용 및 자료형 확인
print(df.head())
print()
print(df.info())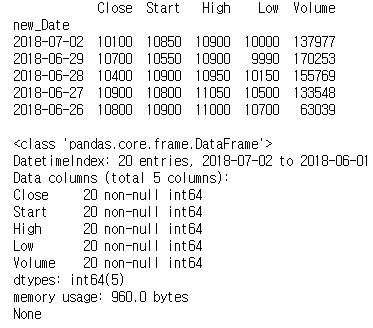
#라이브러리 불러오기
import pandas as pd
#날짜 령식의 문자열로 구성되는 리스트 정의
dates=['2019-01-01','2020-03-01','2021-06-01']

#문자열 데이터(시리즈 객체)를 판다스 Timestamp로 변환
ts_dates=pd.to_datetime(dates)
print(ts_dates)

# Timestamp를 Period로 변환
pr_day = ts_dates.to_period(freq='D')
print(pr_day)
pr_month = ts_dates.to_period(freq='M')
print(pr_month)
pr_year = ts_dates.to_period(freq='A') # annual 의 약자 'A'
print(pr_year)
DatetimeIndex(['2019-01-01', '2020-03-01', '2021-06-01'], dtype='datetime64[ns]', freq=None)
PeriodIndex(['2019-01-01', '2020-03-01', '2021-06-01'], dtype='period[D]', freq='D')
PeriodIndex(['2019-01', '2020-03', '2021-06'], dtype='period[M]', freq='M')
PeriodIndex(['2019', '2020', '2021'], dtype='period[A-DEC]', freq='A-DEC')
#시계열 데이터 만들기
import pandas as pd

#TImestamp의 배열 만들기 - 월 간격, 월의 시작일 기준
ts_ms=pd.date_range(start='2019-01-01', #날짜 범위의 시작
                   end=None, #날짜 범위의 끝
                    periods=6, #생성할 타임스템프 의 개수
                    freq='MS', #시간 간격(MN:월의 시작일)
                    tz='Asia/Seoul' #시간대(timezone)
                   )
print(ts_ms)
DatetimeIndex(['2019-01-01 00:00:00+09:00', '2019-02-01 00:00:00+09:00',
'2019-03-01 00:00:00+09:00', '2019-04-01 00:00:00+09:00',
'2019-05-01 00:00:00+09:00', '2019-06-01 00:00:00+09:00'],
dtype='datetime64[ns, Asia/Seoul]', freq='MS')
# 월 간격, 월의 마지막 날 기준
ts_me = pd.date_range('2019-01-01', periods=6,
                     freq='M', # 시간 간격 (M : 월의 마지막 날)
                     tz='Asia/Seoul') # 시간대(timezone)
print(ts_me)
print('\n')

# 분기(3개월) 간격, 월의 마지막 날 기준
ts_3m = pd.date_range('2019-01-01', periods=6,
                     freq='3M', # 시간간격 3M : 3개월
                      tz='Asia/Seoul') # 시간대(timezone)
print(ts_3m)

# Period 배열

# Period 배열 만들기 - 1개월 길이
pr_m = pd.period_range(start='2019-01-01',
                      end = None,
                      periods=3,
                      freq='M')
print(pr_m)
print('\n')

# Period 배열 만들기 - 1시간 길이
pr_h = pd.period_range(start='2019-01-01',
                      end = None,
                      periods=3,
                      freq='H') # 기간의 길이( H : 시간 )
print(pr_h)
print('\n')

# Period 배열 만들기 - 2시간 길이
pr_2h = pd.period_range(start='2019-01-01',
                      end = None,
                      periods=3,
                      freq='2H')
print(pr_2h)
print('\n')
df = pd.read_csv('stock-data.csv')
df['new_Date'] = pd.to_datetime(df['Date'])
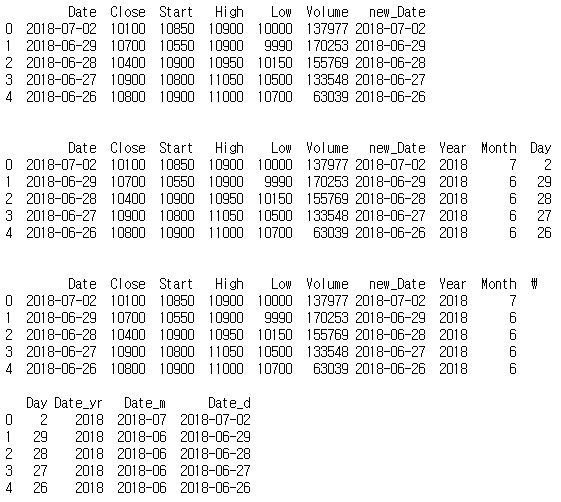
print(df.head())
print('\n')

#dt속성을 이용하여 new_Date 열의 년월일 정보를 년,월,일로 구분
df['Year'] = df['new_Date'].dt.year
df['Month'] = df['new_Date'].dt.month
df['Day'] = df['new_Date'].dt.day
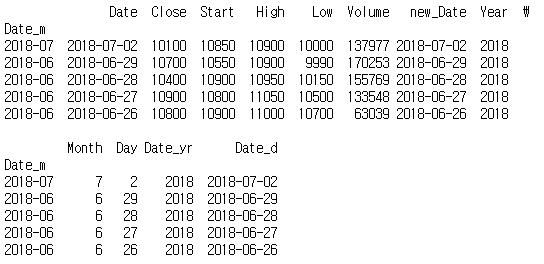
print(df.head())
print('\n')

#Timestamp를 Period로 반환하여 년월일 표기 변경하기
df['Date_yr']=df['new_Date'].dt.to_period(freq='A')
df['Date_m']=df['new_Date'].dt.to_period(freq='M')
df['Date_d']=df['new_Date'].dt.to_period(freq='D')
print(df.head())
print('\n')

# 원하는 열을 새로운 행 인덱스로 지정
df.set_index('Date_m',inplace=True)
print(df.head())
#날짜 인덱스 활용
#연.월.일 중에서 필요로하는 레벨을 선택적으로 인덱싱 할 수 있음
import pandas as pd

#read_csv()함수로 파일을 읽어와서 df로 변환
df=pd.read_csv('stock-data.csv')

#문자열인 날짜 데이터를 판다스 Timestamp로 변환
#Timestamp로 변환
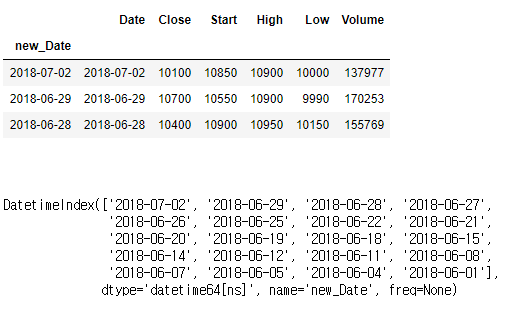
df['new_Date'] = pd.to_datetime(df['Date']) # 새로운 열에 추가
df.set_index('new_Date', inplace=True) #행 인덱스로 지정

display(df.head(3))
print('\n')
display(df.index)
print('\n')
# 시간 간격 계산, 최근 180일 ~ 189일 사이의 값들만 선택하기
today = pd.to_datetime('2018-12-25')       #기준일 생성

df.drop('Date',axis=1, inplace=True)      # object 형태로 구성된 열 제거

df['time_delta'] = today - df.index        #날짜 차이 계산
df.set_index('time_delta', inplace=True)   # 행 인덱스로 지정
df_180 = df['130 days':'189 days']
display(df_180)
':: IT > python' 카테고리의 다른 글
| 20200316 python 판다스(인덱스 정렬) (0) | 2020.03.20 |
|---|---|
| 20200316 python 판다스(pandas) 기초 (시리즈와 데이터프레임) (0) | 2020.03.20 |
| 20200311 python (묘듈, 예외처리, 내장함수, map, 람다) (0) | 2020.03.19 |
| 20200310 python (함수, 사용자 입출력, 파일 읽고 쓰기, 클래스, 상속 ,오버라이딩, 오버로딩) (0) | 2020.03.19 |
| 20200319 python pandas(데이터 전처리) (0) | 2020.03.19 |